Introduction:
Watershed analysis is a valuable tool that utilizes digital elevation models and raster data to delineate watersheds and define features such as stream networks and watershed basins. It is an essential device in a variety of fields including hydrology and environmental modeling. An important aspect of watershed analysis is the spatial scale in which it is performed. At a larger scale, there are fewer watersheds while at a smaller scale, more watersheds are produced. The optimal scale ultimately depends on the level of detail that best suits the sample area. Factors that influence the overall quality of the watershed analysis include the quality of the digital elevation model, the algorithm used for deriving flow directions, and the threshold used to delineate the stream network. In ArcGIS, the D8 algorithm is used because it is simple, efficient, and ideal for evaluating mountainous regions. For this lab, an area-based analysis was performed for the Tibetan Plateau with watersheds created for each stream section. Analyzing the relationship between elevation and drainage networks allows for an understanding of the location of surface water such as lakes. Generating watershed analysis provides the foundational base for further surface modeling.
Methods:
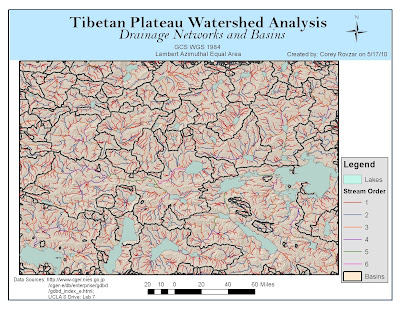
The first step in delineating watersheds involved filling in the depressions within the digital elevation model. For the fill operation, a z-limit of 15 was used because it generated the most practical watershed basins with larger lakes having their own watershed basins. A denser stream network should have more, but smaller, watersheds. Additionally, using this value created watersheds that organized around stream networks and visually, made sense. The z-limit represents the maximum elevation difference between a sink and its pour point. Only sinks that have a difference in z-values between a sink and its pour point that is less than the z-limit will be filled. Using a z-value higher than 15 generated too many watersheds, while using a z-limit lower than 15 generated too few. After the basins were delineated, flow direction was calculated according to the D8 method which is the default method for ArcGIS. This method uses the 8 surrounding cells with a weighted distance to calculate the center cells flow direction. The stream network was created using the Con tool and setting a threshold of greater than or equal to 1,000 cells. The higher the threshold was set, the less detail that the map displayed because a higher threshold value results in a less dense stream network and fewer internal watersheds. While 100, 500, and 700 threshold values were tested, ultimately a threshold of greater than or equal to 1000 seemed to generate the most accurate results with stream networks clearly visible. The final steps involved creating watershed basins, which related to the fill z-limit value, and assigning a stream order to the stream networks which was based on the default Strahler method.
Analysis:
According to the watershed map, the hydrology in the Tibetan Plateau is very extensive with many stream networks and watershed basins. As a result, a large number of lakes have formed with the largest occurring in areas with the most expansive stream networks. Additionally, many of the streams contributing to the formation of lakes have a stream order of 1 suggesting that the water is flowing from a primary source to the lake and thus, more water is able to be collected rather than being diverted to other streams.
Comparison:
By comparing my map, with the downloaded data on watersheds within the Tibetan Plateau region, it is evident that my map is more detailed and has greater accuracy. The data attained from the Global Drainage Basin Database was for all of Asia. As a result, it does not show as much detail for the Tibetan Plateau especially concerning lakes and stream networks. My map shows a much more extensive stream network as well as a greater number of lakes. However, the watershed basins appear to be very similar, suggesting that the z-limit I used when creating a fill was accurate. Other differences include that my map was based on an area-based watershed method while the downloaded data was based on a pour-point watershed method.
Comparing my stream network, basins, and lakes with a landsat image provided by the Global Land Cover suggested that most of the lakes accumulate at a medium elevation. As streams flow down mountains, ultimately most of the water will collect at a medium elevation because at a lower elevation, water has been diverted to other areas through other streams. Ultimately, comparing my generated stream networks and watershed basins with a landsat image allows for an evaluation of patterns of stream flow and lake formation as it relates to elevation.
Problems:
While digital elevation models are extremely useful for performing watershed analysis, the resolution and quality of the DEM can ultimately affect the results. A DEM with a high resolution might be too course to allow for topographic features to be shown and presents difficulty when creating a stream network. Similarly, a higher-resolution DEM might also generate smaller watershed areas compared to lower-resolution DEMs. DEMs must also be of good quality in order to allow for an accurate fill. The fill is one of the foundational steps for the analysis. Therefore, having an accurate fill will allow for greater accuracy in modeling the watershed. Ultimately, the best ways to eliminate problems with DEMs is to attain them from a reliable source and to run the watershed analysis on a variety of DEMs until accurate results are attained.


No comments:
Post a Comment