Tuesday, April 27, 2010

Lab 4- Interpolation


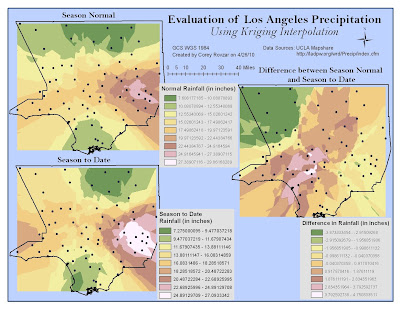
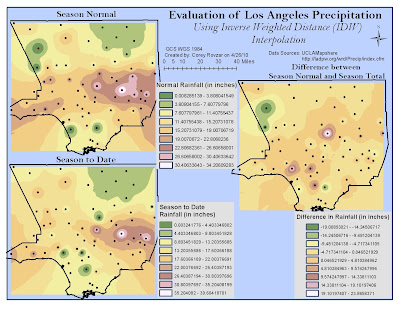
Interpolation is the process by which unknown values in a dataset are predicted based upon known samples. It employs the principle of spatial autocorrelation in order to determine the interrelatedness between points, and if there is interrelatedness, it will determine whether or not there is a spatial pattern. Two types of interpolation include Inverse Distance Weighting (IDW) and Kriging. IDW is a deterministic technique that involves using a linear-weighted combination set of sample points in order to interpolate unknown values. Known points closer to the interpolated value will have greater weight, wheareas those farther will have less weight. Overall, this method is beneficial when a data set consists of many samples that capture the extent of local surface variation. In contrast, Kriging is a statistical interpolation technique that considers the distance and direction between sample points in order to evaluate interrelatedness between points and determine surface variations. A weighted average technique is used to measure relatedness between sample points and interpolate unknown values. A fixed or variable search radius is used to predict values and the surface does not pass through any of the points.
For this lab, precipitation levels for Los Angeles County were evaluated through interpolation by considering the normal precipitation levels and total season-to-date levels that were measured at various rain gauges. Both IDW and Kriging were conducted using the given parameters by ArcGIS. Based on the season normal and season total values for both interpolation maps, is evident that the highest amounts of rainfall occur in south-eastern Los Angeles while the lowest amounts are found in the far north and southern areas. However, the IDW and Kriging methods generate varying results when evaluating the difference in precipitation levels between the season normal and season total. In the IDW map, this season’s precipitation levels appear to be about average compared with the season normal, with only a few areas of either higher than average or lower than average precipitation. In contrast, the Kriging method generated more variable results with this season’s precipitation levels being greatly below average in the northwest, slightly above average centrally, and about equal to the average in the east of Los Angeles. Both interpolation methods produced surprising results because this year is an El Nino year; therefore, it is expected that there be higher than normal precipitation levels. However, the maps suggest that overall, this season’s rainfall has not been significantly higher than normal. It is important to consider that the season normal includes precipitation values from extreme El Nino years that might include unusually high values that may cause the season normal values to be skewed higher.
I believe that IDW is the best method for interpolating precipitation values for the season normal, season total, and the difference between the season normal and total because there are a significant number of sample points and precipitation does not normally vary significantly from nearby areas. Therefore, areas closest to an interpolated value are most likely to better estimate rainfall for that area and should have greater weight. Additionally, IDW interpolation passes through all the sample points, allowing for the points to influence the interpolated values, whereas Kriging does not. Kriging would not be as accurate because the spatially correlated distance and directional bias for the data set are not known. However, Kriging would be an optimal choice if we wanted to estimate error and the level of uncertainty within the interpolation. Splining would be the last method I would use for the interpolation because it creates smooth surfaces when connecting the points, and as a result, can be misleading depending on the distance between points. For this lab, splining produced negative values for both the season normal and season total precipitation levels. Because rainfall values cannot be negative, this interpolation would be confusing to a person with no understanding of the splining technique. Overall, each method has both positives and negatives. By manipulating the parameters, different patterns will be shown. Ultimately, it is up to the GIS user to decide which method is relevant to the study topic and generates spatial patterns that best simulate reality.
Tuesday, April 20, 2010

Lab 3- Slope/fuel hazard model

Slope/Fuel Hazard Model

Assessing fire hazards in fire prone areas is vital for fire management and prevention. Two principle factors influencing wildland fire susceptibility include slope and vegetation type, which acts as fuel for fires. Additionally, weather patterns will also influence the risk of fire. Areas with steeper slopes will cause more rapid spread upslope due to the proximity of the flame to overhead fuel. Vegetation types that are highly prone to acting as fuels for fires include shrublands and hardwoods. Lastly, hot and dry weather acting with winds can act as the igniting force to start wild fires. In the Sequoia and Kings Canyon National Park, fire is an essential component for the regeneration of many plant species as well as for maintaining the livelihoods of native animals (http://www.nps.gov/archive/seki/fire/indxfire.htm). Suppression of fire in this area has led to the accumulation of debris resulting in intense, widespread fires. In order to prevent massive fires and sustain the fire-dependent ecosystems, prescribed fires have been used within the area. Evaluating the slope and surface fuels within this region allows for an assessment of the overall risk of fire and ultimately provides a model for future wild fire management.
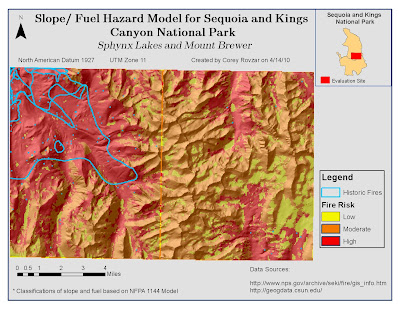
The study site for the slope/ fuel hazard incorporated two 7.5 minute quadrangles, Sphynx Lakes and Mount Brewer, within the Sequoia and Kings Canyon National Park. The slope was calculated for the study site and reclassified using the NFPA Model 1144 standards. This model was created by the National Fire Protection Agency to evaluate the relationship between slope and fuel and their effect on fire risk within an area According to this model, slope was classified based on NFPA hazard points: 1, 4, 7, 8, and 10. These corresponded, respectively, with minimum-maximum percent slope categories: 0-10, 10-20, 20-30, 30-40, and 40-999.The vegetation types for study site included white fir mixed conifer forest, lodgepole pine forest, barren rock with sparse vegetation, red fir forest, montane chaparral, subalpine conifer forest, meadow, other (mostly water bodies), ponderosa- mixed conifer forest, and xeric conifer forest. Similar to the slope reclassification, the vegetation types were assigned a fuel class along with the associated NFPA hazard points based on the NFPA Model 1144. The classes within this model include non fuel, light, medium, heavy, and slash, and correlate, respectively, with the hazard points 0, 5, 10, 20, and 25. The reclassification of the study site vegetation types included other as a non fuel (0), meadow and barren rock with sparse vegetation as light fuels (5), xeric conifer forest as medium (10), and all other forests as well as montane chaparral as heavy fuels (20). After reclassifying the slope and fuel types, the values were added to create the slope/ fuel hazard model. Areas with lower values (0-9) have a low burn hazard whereas areas with slightly higher values (10-19) have a moderate burn hazard and areas with the highest values (20-30) have a high burn hazard value.
In addition to evaluating slope and fuel, historic fires within the region were also displayed. By evaluating the model, it is evident that historic fires have occurred in areas with a high risk to fire. Understanding the factors behind wildfires as well as the location of past fires in the region allows for better planning of prescribed fires as well as prevention of large-scale wild fires.
Although it would be easier to display a vegetation map and a slope map, combining the two data sets by creating a slope/fuel hazard model allows for an evaluation of how the two factors interact and influence fire burn hazards in a region. By utilizing spatial analysis within GIS, models can be generated to display how environmental factors react and their impact on natural occurrences such as wild fires.


Tuesday, April 13, 2010

Lab 2- Using DEMs


Digital Elevation Models (DEMs) are commonly used in GIS to provide elevation data and permit spatial analyses for specific geographic areas. Within a GIS, spatial analyses can be conducted to calculate slope, aspect, and hill shade of a DEM in order to greater understand the terrain surface as it relates to elevation. In GIS, slope refers to the rate of change of elevation at a surface location, while aspect is concerned with the directional measure of the slope, and lastly, hill shade involves modeling the appearance of the terrain by evaluating the relationship between sunlight and surface features. The focus of this lab was to utilize a DEM to evaluate the potential risk of landslides occurring in Pacific Palisades, CA. The DEM, with its hill shade and slope, was analyzed in order to better understand the terrain surface of Pacific Palisades and evaluate the risk of landslides occurring relative to surrounding areas in Los Angeles.
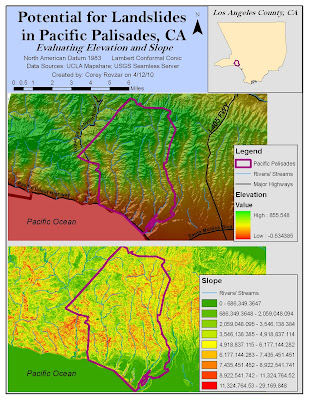
In order to conduct the spatial analysis for Pacific Palisades, a DEM of the area as well as surrounding areas was downloaded from the USGS Seamless Server with 1/3 arc second resolution. The Pacific Palisades boundary was found within the Los Angeles County subdivision data that was attained from the UCLA Mapshare website. A hill shade was calculated and set with a 50% transparency behind the original DEM to show a more realistic model of the terrain surface. Additionally, slope was calculated to evaluate the dramatic changes in elevation for Pacific Palisades relative to surrounding Los Angeles areas. Lastly, data on major highways and streams and rivers were added to provide referential information of the area.
Landslides are more likely to occur in areas with a steep slope, unstable soil, high moisture content, and exposure to erosion by wave action (http://nsgd.gso.uri.edu/scu/scug73002.pdf). According to the DEM, hill shade, and slope models, the Pacific Palisades area has a high elevation with a high slope relative to the surrounding Los Angeles area. Additionally, the area contains many streams and rivers resulting in greater soil instability and thus, greater susceptibility to landslides. Close proximity to the Pacific Ocean results in exposure to wave erosion which increases the risk for landslides. While these factors do not directly cause a landslide, they contribute to the gradual accumulation of stress on the land. When a disturbance such as excessive rainfall or an earthquake occurs, the already weakened terrain surface falls along with the houses and other urban development atop. In Pacific Palisades, over 50 landslides have occurred despite efforts to reinforce the unstable soil of the bluffs (http://nsgd.gso.uri.edu/scu/scug73002.pdf). Despite the high risk to landslides, houses continue to be built and bought at high prices by individuals valuing the aesthetic value of living in Pacific Palisades. A better alternative might be to encourage greater housing development concentrated in either lower-lying cities, such as Santa Monica, or further inland areas, such as Brentwood. Diminishing the number of houses and people living on land highly susceptible to landslides will ultimately result in less damage and injuries when landslides occur.
Digital Elevation Models along with spatial analyses are important tools that allow for an assessment of surface terrain to greater understand issues such as landslide susceptibility. By cartographically displaying elevation data, places can be assessed relative to surrounding areas and solutions can be generated before disturbances and potential disasters occur. Ultimately, planning ahead and taking preventative measures are the best ways to ensure safety and prevent massive damage when landslides occur. Utilizing DEMs and evaluating their slope and hill shade provides knowledge of the terrain surface that enhances the planning and preparation to mitigate the overall damage caused by landslides or other natural catastrophes.

Lab 1- Mapping Cell Towers


In the past decade, the use of cell phones throughout the world has greatly increased as technology has continued to reformat the devices to make them more user-friendly and accessible. In the United States, about 270 million mobile cellular telephones are in use, representing about 89% of the population (The World Factbook). In order to provide cell phone reception for users, it is necessary to implement cell phone towers which communicate with each other to allow for the device to connect to the server. Server companies might include AT&T, Sprint, Verizon, etc., and each has their own towers. More populated areas will most likely have a greater number of cell phone users. As a result, cell phone towers should be located in densely populated urban areas in order to accommodate the greatest amount of users. Similarly, areas with small populations, such as rural farms, should have significantly fewer cell towers due to fewer users. Therefore, locating cell towers is important as it can give information regarding the spatial distribution of populations. Additionally, locating cell towers becomes important when evaluating the potential health effects as well as property value depreciation caused by cell tower transmissions.
In my map on the location of cell towers in Orange County, there is a pattern of the cell towers being located in more populated cities as well as near major freeways. Additionally, there tends to be more cell towers located in the more affluent regions of Orange County. Wealthier people are likely to have more cell phone use compared to lower-income individuals. In Orange County, there tends to be wealthy people concentrated near the coastline. As a result, there are greater numbers of cell towers on the coast compared to inland regions. It would be expected that there would be greater numbers of cell towers near airports due to the high volume of people within these small areas. However, based on the map, there was no pattern found for more cell towers to be located near airports.
Not only can cell tower location provide insight into the current distribution of populations, but also the emergence of new cities that will most likely experience expanding populations. When new housing developments and complexes are built, the population in that area increases. As a result, cell phone companies will seek to provide greater service to these areas and will most likely build cell towers. In Orange County, the population change from 1990-2000 was +18.1%. To accommodate an expanding population, more cell towers were most likely built. Comparing the location of cell towers each year could provide insight into the developmental history of an area as well as changes in population distribution.
Despite the desire for phone companies to increase their numbers of users, cell tower location has caused some conflict with residents. There has been some speculation that close proximity to cell towers could lead to a greater likelihood of developing cancer and other health risks. However, there has been no scientific evidence to support this claim (http://www.cancer.org/docroot/PED/content/PED_1_3X_Cellular_Phone_Towers.asp). Additional issues surrounding the location of cell towers include blocking views and devaluing property. In order to appease residents, companies will often pay rent to the property owner where the tower resides. Overall, there has been little research conducted on cell towers and health risks because they are a relatively new technology. If it is found that cell towers do produce health risks, then locating cell towers will be crucial in order to evaluate who might be affected as well as inform potential buyers of the level of exposure they will have to cell towers in the area. Because cell towers are concentrated in more densely populated areas, findings that cell towers have negative effects on health could be catastrophic and would result in the need to relocate most of the existing towers. Locating cell towers provides the first step in analyzing the potential effects that the radio transmissions can have on people living nearby.